PropNex Picks
|March 20,2025Resale Condo Market Watch in February 2025
Share this article:
Resilient resale condo activity in February amidst robust new launch market

Sales momentum in the resale condo market rallied in February, with 892 condo units worth $1.97 billion being resold during the month - compared with the 868 resale transactions valued at nearly $1.91 billion transacted in January.
The pick-up in market activity could have been spurred by a flurry of new launches, which may have helped to stoke overall buying interest. In February, new sales transactions accounted for 62% of non-landed transactions, while resale transactions accounted for 35% of transactions, one of the lowest resale proportions since January 2024 (see Chart 1).
Chart 1: Proportion of private non-landed transactions (excl. EC) by sale type by month
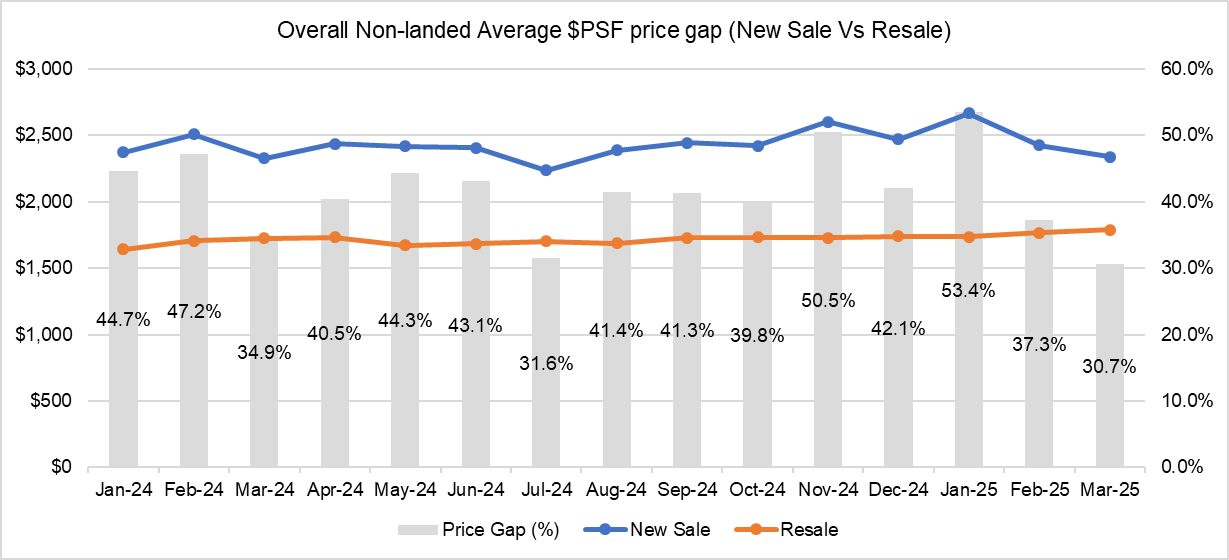
In spite of the resurgence in new launch activity, there was a drop in the average new launch pricing for the month due to the bigger proportion of mass market homes sold. The average new sales price fell by nearly 9% month-on-month (MOM) to $2,452 psf in February, while the average resale price inched up by 1.7% MOM. As such, the new sale and resale price gap dropped to a 6-month low in February to 37% (see Chart 2) - the last low was in July 2024 when the price gap dipped to 31.6%.
Chart 2: New sale and Resale Price gap of non-landed homes (overall) by month
In terms of profitability, resale condo homes transacted in February saw an improvement in gains compared to the previous month. Analysing the profits reaped by resale non-landed homes in January and February 2025, it was found that resale condo deals garnered slightly higher profits, and there were fewer loss-making transactions in February 2025 compared to the previous month. The resale profit analysis involves computing gains achieved for the units by matching the condo resale transactions in February with their previous purchase prices, according to caveats lodged.
Of note, 15.7% of resale condo transactions (115 deals) in February made more than $1 million in profits, compared with 14.3% in January. Of these million-dollar profit-making deals, the majority (38.3%) came from the city fringe or Rest of Central Region (RCR), followed by Outside Central Region (OCR) homes (33%) and Core Central Region (CCR) homes (28.7%). Loss-making deals in February accounted for 3.3% of transactions, improving from the 4.2% in January (see Chart 3).
Chart 3: Proportion of profit quantum of resale non-landed transactions (Jan 2025 vs Feb 2025)
The average profit was subsequently computed on a project basis. To minimise sampling errors, resale condominium projects that posted fewer than three transactions during the month are excluded from the study. Based on URA Realis caveat data analysed by PropNex Research, the overall most profitable condo project, as well as in the CCR, was the Leedon Residence located in District 10, which pulled in an average profit of $1.24 million across three transactions.
Top Resale Condo projects^ in terms of average gross profit* by region
Project Name | No. of transactions | Average Profit Gained ($) | Average Annualized Profit (%)# | Year completed | District |
CCR | |||||
| LEEDON RESIDENCE | 3 | $1,243,346 | 3.6% | 2015 | 10 |
| PAVILION 11 | 3 | $1,135,629 | 3.6% | 2009 | 11 |
| HILLCREST ARCADIA | 3 | $823,333 | 3.6% | 1980 | 11 |
RCR | |||||
| ONE AMBER | 4 | $1,006,650 | 6.1% | 2010 | 15 |
| TREVISTA | 5 | $949,448 | 4.3% | 2011 | 12 |
| RIVER PLACE | 3 | $853,047 | 2.3% | 2000 | 3 |
OCR | |||||
| DOUBLE BAY RESIDENCES | 3 | $922,835 | 4.9% | 2012 | 18 |
| THE MINTON | 3 | $781,859 | 4.2% | 2013 | 19 |
| FLAMINGO VALLEY | 3 | $764,263 | 3.2% | 2014 | 15 |
In the city fringe or RCR, the most profitable condo project was One Amber, a project located in District 15, which pulled average profits of over $1 million, across 4 transactions. In the heartlands or Outside Central Region (OCR), the most profitable project was a district 18 (Pasir Ris, Tampines) project, Double Bay Residences which pulled average profits of nearly $923,000 in February across 3 transactions.
Going by districts, resale homes in District 10 (Holland, Bukit Timah) raked in the highest profits on quantum basis, with transactions reaping average gains of nearly $979,000 per deal. In terms of annualised gains, resale homes in district 28 (Seletar, Yio Chu Kang) enjoyed an average annualized profit of 5% per deal.
Top 10 Resale Condo districts^ in terms of average gross profit*
District | No. of transactions** | Average Gains ($) | Average Annualised Gains (%)# |
D10 | 40 | $978,613 | 3.1% |
D26 | 5 | $776,138 | 4.3% |
D21 | 29 | $774,395 | 4.7% |
D11 | 27 | $743,739 | 3.5% |
D15 | 74 | $708,077 | 4.5% |
D20 | 28 | $691,221 | 4.7% |
D9 | 30 | $686,155 | 1.9% |
D22 | 12 | $639,073 | 4.3% |
D12 | 22 | $601,086 | 3.5% |
D5 | 42 | $585,881 | 4.1% |
Analysing individual deals by gross profit quantum, it was found that the top five gainers from each region ranged from $6.5 million to $1.5 million. The units which chalked up larger gains were mostly sizeable large format condos that are more than 1,200 sq ft in size, and consisted mostly of older projects built in the 1970s to early 2000s. The respective holding periods for the most profitable resale properties were mostly beyond 10 years - the oldest being a unit held for nearly 26 years.
Top 5 Resale Condo transactions in February 2025 by gross profit by region
It was found that the overall most profitable transaction and top gainer in the CCR was for a 25th floor unit at Yong An Park. It was resold for an estimated profit of $6.5 million, reflecting an annualised profit of 4.2%. Based on URA Realis caveat data, the 6,878-sq ft unit was first bought in April 2011 and subsequently resold for $15 million in February 2025, with a holding period of nearly 15 years. The freehold project in River Valley was built in 1986, and it is situated within close proximity to Great World MRT station on the Thomson East Coast line.
The top gainer in the RCR in terms of gross profit was for unit transacted at Mount Faber Lodge in district 4, which fetched a gross profit $3.4 million (annualised profit of 5%) based on caveats lodged. The 3,703 sq ft 7th floor apartment was sold for $5 million, with a holding period of more than 23 years. The freehold project in Bukit Merah was built in 1983, and it is situated within close proximity to Mount Faber and short drive to the commercial node at Harbourfront and its amenities including VivoCity, Harbourfront Centre and Ferry Terminal as well as Sentosa Island.
The top gainer in the OCR for the month was for a 5th floor unit located in Mandarin Gardens. The 3,800-sq ft unit was sold for $4.88 million, achieving an estimated profit of around $3.83 million which reflects a decent annualised profit of 7.4% over a holding period of about 19 years. The 99-year leasehold project was built in 1986 and a short walk to the newly-opened Siglap MRT station on the Thomson-East-Coast line (TEL). The project is located close to the East Coast Park and situated next to Victoria School.
With rising new launch prices, condo resellers may stand to benefit as some homebuyers may find themselves priced out of the new launch market and consider options in the resale segment. To that end, resale gains may potentially see some slight upside, particularly amidst moderating interest rates and positive economic outlook.
Views expressed in this article belong to the writer(s) and do not reflect PropNex's position. No part of this content may be reproduced, distributed, transmitted, displayed, published, or broadcast in any form or by any means without the prior written consent of PropNex.
For permission to use, reproduce, or distribute any content, please contact the Corporate Communications department. PropNex reserves the right to modify or update this disclaimer at any time without prior notice.